Contour 學習筆記(一):使用 Contour 接管 Kubernetes 的南北流量

> 原文連接:Contour 學習筆記(一):使用 Contour 接管 Kubernetes 的南北流量html
在 Kubernetes 中運行大規模以 Web 爲中心的工做負載,最關鍵的需求之一就是在 L7 層實現高效流暢的入口流量管理。自從第一批 Kubernetes Ingress Controller 開發完成以來,Envoy(由 Matt Klein 和 Lyft 團隊開發)已經成爲雲原生生態系統中的新生力量。Envoy 之因此受到支持,由於它是一個 CNCF 託管的項目,與整個容器圈和雲原生架構有着自然的支持。git
容器公司 Heptio 開源的項目 Contour 使用 Envoy 做爲 Kubernetes 的 Ingress Controller 實現,爲你們提供了一條新的 Kubernetes 外部負載均衡實現思路。github
據官方博客介紹,Heptio Contour 能夠爲用戶提供如下好處:正則表達式
- 一種簡單的安裝機制來快速部署和集成 Envoy。
- 與 Kubernetes 對象模型的集成。
Ingress配置的動態更新,而無需重啓底層負載均衡器。- 項目成熟後,將容許使用 Envoy 一些強大的功能,如熔斷器、插件式的處理器鏈,以及可觀測性和可調試性,能夠很是方便地對接監控系統。
- IngressRoute 之間能夠級聯,用來作藍綠部署很是方便。
下面咱們就來試用一下。算法
1. 安裝步驟
Contour Ingress controller 由兩個組件組成:json
Envoy: 提供高性能反向代理。Contour: 充當 Envoy 的控制平面,爲 Envoy 的路由配置提供統一的來源。
官方文檔提供了三種部署方法:bootstrap
- 經過
DaemonSet來部署,每一個節點上跑一個 Contour 實例(Contour 與 Envoy 在同一個 Pod 中)。 - 經過
Deployment來部署,總共跑兩個 Contour 實例(Contour 與 Envoy 在同一個 Pod 中)。 - 經過 Deployment 來部署 Contour,總共跑兩個 Contour 實例;經過 DaemonSet 來部署 Envoy,每一個節點上跑一個 Envoy 實例。
通過老夫目測,第三種方案比較妙,這樣可讓 Contour 和 Envoy 這兩個組件解耦,能夠分別按需對不一樣的組件進行擴展,具體的優點以下:api
- Envoy 以 Daemonset 的形式運行,具備很強的擴展性,後續可經過
ipvs和keepalived等工具來實現其負載均衡和高可用。 - Envoy 運行的網絡模式是
hostNetwork,減小了額外的網絡性能損耗。 - Contour 與 Envoy 之間經過雙向認證的自簽名證書進行通訊,大大加強了安全性。
- 升級 Contour 不須要重啓 Envoy。
聽起來好像不錯的樣子。瀏覽器
咱們就採用第三種方案來部署,首先克隆官方倉庫,進入 manifest 清單目錄:緩存
$ git clone https://github.com/heptio/contour
$ cd contour/examples/ds-hostnet-split
爲了便於查看 envoy 的配置,修改 03-envoy.yaml,將 envoy 的 admin-adress 設置爲 0.0.0.0,並暴露 9001 端口:
...省略...
initContainers:
- args:
  - bootstrap
  - --admin-address=0.0.0.0
  - /config/contour.json
...省略...
將 Envoy Service 的類型改成 ClusterIP:
$ cat 02-service-envoy.yaml
apiVersion: v1
kind: Service
metadata:
 name: envoy
 namespace: heptio-contour
 annotations:
   service.beta.kubernetes.io/aws-load-balancer-type: nlb
spec:
 externalTrafficPolicy: Local
 ports:
 - port: 80
   name: http
   protocol: TCP
 - port: 443
   name: https
   protocol: TCP
 selector:
   app: envoy
 type: ClusterIP
部署:
$ kubectl apply ./
查看狀態:
$ kubectl -n heptio-contour get pod
NAME                       READY   STATUS      RESTARTS   AGE
contour-767fd99989-27qjw   0/1     Running     0          21s
contour-767fd99989-kcjxz   0/1     Running     0          21s
contour-certgen-29nqs      0/1     Completed   0          21s
envoy-cnzvm                0/1     Running     0          21s
envoy-lb8mm                0/1     Running     0          21s
envoy-qzmt4                0/1     Running     0          21s

$ kubectl -n heptio-contour get job
NAME              COMPLETIONS   DURATION   AGE
contour-certgen   1/1           2s         4m42s
contour-certgen 是一個 Job,它會生成有效期爲一年的 mTLS(雙向認證)證書,並將其掛載到 Contour 和 Envoy 的容器中。若是你想自定義證書,能夠參考官方文檔。
> 若是你尚未部署 Kubernetes 集羣怎麼辦?廢話,固然是用 sealos 啊!分分鐘搞起一個高可用集羣。
2. Ingress 測試
安裝結束後,咱們就能夠來測試 Ingress 了。在 examples/example-workload 目錄下包含一個示例應用,能夠直接使用:
$ kubectl apply -f examples/example-workload/kuard-ingressroute.yaml
查看建立好的資源:
$ kubectl get po,svc,ingressroute -l app=kuard
NAME                         READY   STATUS    RESTARTS   AGE
pod/kuard-67789b8754-5c4w7   1/1     Running   0          63s
pod/kuard-67789b8754-fpdfb   1/1     Running   0          63s
pod/kuard-67789b8754-fx9bn   1/1     Running   0          63s

NAME            TYPE        CLUSTER-IP    EXTERNAL-IP   PORT(S)   AGE
service/kuard   ClusterIP   10.97.46.79   <none>        80/TCP    63s

NAME                                    FQDN          TLS SECRET   FIRST ROUTE   STATUS   STATUS DESCRIPTION
ingressroute.contour.heptio.com/kuard   kuard.local                /             valid    valid IngressRoute
將域名加入本地電腦的 hosts:
$ echo "$INGRESS_HOST kuard.local" >> /etc/hosts
其中 $INGRESS_HOST 是任意運行 Envoy 節點的 IP。
如今咱們就能夠在瀏覽器中輸入域名 kuard.local 訪問應用了:
3. Contour 工做原理
Contour 同時支持 Ingress 資源對象和 IngressRoute 資源對象(經過 CRD 建立),這些對象都是爲進入集羣的請求提供路由規則的集合。這兩個對象的結構和實現方式有所不一樣,但它們的核心意圖是相同的,都是爲進入集羣的請求提供路由規則。如不做特殊說明,後面當咱們描述 「Ingress」 時,它將同時適用於 Ingress 和 IngressRoute 對象。
一般狀況下,當 Envoy 配置了 CDS 的 endpoint 時,它會按期輪詢端點,而後將返回的 JSON 片斷合併到其運行配置中。若是返回到 Envoy 的集羣配置表明當前的 Ingress 對象的集合,則能夠將 Contour 視爲從 Ingress 對象到 Envoy 集羣配置的轉換器。隨着 Ingress 對象的添加和刪除,Envoy 會動態添加並刪除相關配置,而無需不斷從新加載配置。
在實踐中,將 Ingress 對象轉換爲 Envoy 配置更加微妙,須要將 Envoy 中的 xDS 配置(包括 CDS,EDS 和 RDS)映射到 Kubernetes 中。Contour 至少須要觀察 Ingress、Service 和 Endpoint 這幾個資源對象以構建這些服務的響應,它經過 client-go 的 cache/informer 機制免費得到這些 watchers。這些 watchers 提供添加,更新和刪除對象的邊緣觸發通知,也能夠經過 watch API 在本地緩存緩存對象,以便後續查詢。
Contour 將收集到的這些對象處理爲虛擬主機及其路由規則的有向非循環圖(DAG),這代表 Contour 將有權構建路由規則的頂級視圖,並將羣集中的相應服務和TLS祕鑰鏈接在一塊兒。一旦構建了這個新的數據結構,咱們就能夠輕鬆實現 IngressRoute 對象的驗證,受權和分發。改數據結構導出的 png 圖片以下圖所示:
<center>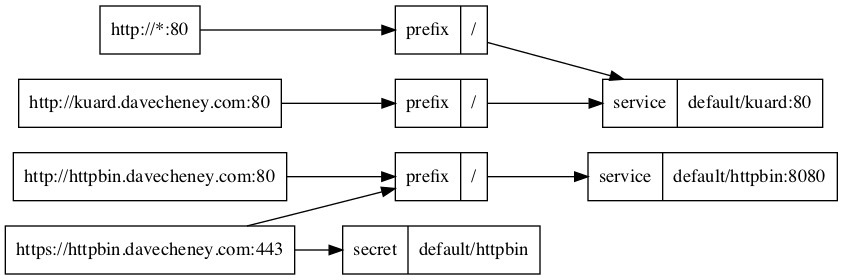</center>
Envoy API 調用和 Kubernetes API 資源之間的映射關係以下:
-
CDS : 集羣發現服務。映射爲 Kubernetes 中的
Service以及一部分 Ingress 對象的TLS配置。 -
EDS : 服務發現服務。映射爲 Kubernetes 中的
Endpoint。Envoy 使用 EDS 自動獲取Cluster成員,這與 Endpoint 對象中包含的信息很是匹配。Envoy 使用 Contour 在EDS響應中返回的名稱查詢EDS。 -
RDS : 路由發現服務。映射爲 Kubernetes 中的
Ingress。提供了虛擬主機名和前綴路由信息的 RDS 與 Ingress 匹配得更好。
4. 映射關係詳情
CDS
CDS 更像是 Kubernetes 中的 Service 資源,由於 Service 是具體 Endpoint(Pods)的抽象,Envoy Cluster 是指 Envoy 鏈接到的一組邏輯上類似的上游主機(參考下文的 RDS)。其中 TLS 配置也是 CDS 的一部分,而 Kubernetes 中的 TLS 信息由 Ingress 提供,因此這部分之間的映射關係會有些複雜。
EDS
EDS 更像是 Kubernetes 中的 Endpoint 資源,這部分映射關係的實現最簡單。Contour 將 Endpoint 的響應對象轉換爲 EDS 的 { address: [] } json 配置塊。
RDS
RDS 更像是 Kubernetes 中的 Ingress 資源。RDS 將前綴,路徑或正則表達式之一路由到 Envoy 羣集。Envoy 集羣的名稱能夠從 Ingress 的 IngressSpec 的配置項中獲取(好比:namespace/serviceName_servicePort),由於這是一個選擇器,它會匹配 Service 對象被轉換後返回的 CDS 對象。
5. Contour 架構分析
Contour Ingress controller 由兩個組件組成:
Envoy: 提供高性能反向代理。Contour: 充當 Envoy 的控制平面,爲 Envoy 的路由配置提供統一的來源。
以本文的部署方式爲例,在 Envoy 的 Pod 初始化期間,Contour 做爲 Init 容器運行,並將 bootstrap(初始化)配置寫入一個 temporary volume。該 Volume 被傳遞給 Envoy 容器並告訴 Envoy 將另外一個 Deployment 中的 Contour 容器視爲控制平面。
初始化完成後,Envoy 容器啓動,檢索 Contour 寫入的 bootstrap 配置,並開始輪詢 Contour 以熱更新配置。若是控制平面沒法訪問,Envoy 將會進行優雅重試。
Contour 至關於 Kubernetes API 的客戶端。它監視 Ingress,Service 和 Endpoint 對象,並經過將其對象緩存轉換爲相關的 JSON 字段來充當其 Envoy 的控制平面。
從 Kubernetes 到 Contour 的信息轉換是經過 SharedInformer 框架 watching API 來完成的;而從 Contour 到 Envoy 的信息轉換是經過 Envoy 按期輪詢來實現的。
6. IngressRoute 介紹
Ingress 對象從 Kubernetes 1.1 版本開始被引進,用來描述進入集羣的請求的 HTTP 路由規則。但迄今爲止 Ingress 對象還停留在 beta 階段,不一樣的 Ingress Controller 插件爲了添加 HTTP 路由的額外屬性,只能經過添加大量的 annotation 來實現,並且每一個插件的 annotation 都不同,很是混亂。
IngressRoute CRD 的目標就是擴展 Ingress API 的功能,以便提供更豐富的用戶體驗以及解決原始設計中的缺點。
**目前 Contour 是惟一支持 IngressRoute CRD 的 Kubernetes Ingress Controller。**下面就來看看它與 Ingress 相比的優勢:
- 安全地支持多團隊 Kubernetes 集羣,可以限制哪些命名空間能夠配置虛擬主機和 TLS 憑據。
- 容許將路徑或域名的路由配置分發給另外一個命名空間。
- 接受單個路由中的多個服務,並對它們之間的流量進行負載均衡。
- 無需經過添加
annotation就能夠定義服務權重和負載均衡策略。 - 在建立時驗證 IngressRoute 對象,並在建立後報告驗證是否有效。
從 Ingress 到 IngressRoute
一個基本的 Ingress 對象以下所示:
# ingress.yaml
apiVersion: extensions/v1beta1
kind: Ingress
metadata:
  name: basic
spec:
  rules:
  - host: foo-basic.bar.com
    http:
      paths:
      - backend:
          serviceName: s1
          servicePort: 80
這個 Ingress 對象名爲 basic,它將傳入的 HTTP 流量路由到頭文件中 Host: 字段值爲 foo-basic.bar.com 且端口爲 80 的 s1 服務。該路由規則經過 IngressRoute 來實現以下:
# ingressroute.yaml
apiVersion: contour.heptio.com/v1beta1
kind: IngressRoute
metadata:
  name: basic
spec:
  virtualhost:
    fqdn: foo-basic.bar.com
  routes:
    - match: /
      services:
        - name: s1
          port: 80
對應關係很簡單,我就再也不詳細介紹了,更多功能配置能夠參考官方倉庫的文檔:IngressRoute。
7. Envoy 初始配置文件
Contour 會根據啓動參數和 K8S API Server 中的配置信息生成 Envoy 的初始配置文件,可使用下面的命令將 Envoy Pod 中的配置文件導出來查看其中的內容:
$ kubectl -n heptio-contour exec envoy-lb8mm -- cat /config/envoy.json > envoy.json
打開網站 https://www.bejson.com/jsonviewernew/,將配置文件內容複製粘貼進去,能夠看到配置文件的結構如圖所示:
其中各個配置節點的內容以下:
Dynamic_resources
配置動態資源,這裏配置了 LDS 和 RDS 服務器。
"dynamic_resources": {
  "lds_config": {
    "api_config_source": {
      "api_type": "GRPC",
      "grpc_services": [
        {
          "envoy_grpc": {
            "cluster_name": "contour"
          }
        }
      ]
    }
  },
  "cds_config": {
    "api_config_source": {
      "api_type": "GRPC",
      "grpc_services": [
        {
          "envoy_grpc": {
            "cluster_name": "contour"
          }
        }
      ]
    }
  }
}
Static_resources
配置靜態資源,包括了 contour 和 service-stats 兩個 cluster,其中 contour cluster 對應前面 dynamic_resources 中的 LDS 和 RDS 配置,指明瞭 Envoy 用於獲取動態資源的服務器地址。
"static_resources": {
  "clusters": [
    {
      "name": "contour",
      "alt_stat_name": "heptio-contour_contour_8001",
      "type": "STRICT_DNS",
      "connect_timeout": "5s",
      "load_assignment": {
        "cluster_name": "contour",
        "endpoints": [
          {
            "lb_endpoints": [
              {
                "endpoint": {
                  "address": {
                    "socket_address": {
                      "address": "contour",
                      "port_value": 8001
                    }
                  }
                }
              }
            ]
          }
        ]
      },
      "circuit_breakers": {
        "thresholds": [
          {
            "priority": "HIGH",
            "max_connections": 100000,
            "max_pending_requests": 100000,
            "max_requests": 60000000,
            "max_retries": 50
          },
          {
            "max_connections": 100000,
            "max_pending_requests": 100000,
            "max_requests": 60000000,
            "max_retries": 50
          }
        ]
      },
      "tls_context": {
        "common_tls_context": {
          "tls_certificates": [
            {
              "certificate_chain": {
                "filename": "/certs/tls.crt"
              },
              "private_key": {
                "filename": "/certs/tls.key"
              }
            }
          ],
          "validation_context": {
            "trusted_ca": {
              "filename": "/ca/cacert.pem"
            },
            "verify_subject_alt_name": [
              "contour"
            ]
          }
        }
      },
      "http2_protocol_options": {}
    },
    {
      "name": "service-stats",
      "alt_stat_name": "heptio-contour_service-stats_9001",
      "type": "LOGICAL_DNS",
      "connect_timeout": "0.250s",
      "load_assignment": {
        "cluster_name": "service-stats",
        "endpoints": [
          {
            "lb_endpoints": [
              {
                "endpoint": {
                  "address": {
                    "socket_address": {
                      "address": "0.0.0.0",
                      "port_value": 9001
                    }
                  }
                }
              }
            ]
          }
        ]
      }
    }
  ]
}
Admin
配置 Envoy 的日誌路徑以及管理端口。
"admin": {
  "access_log_path": "/dev/null",
  "address": {
    "socket_address": {
      "address": "0.0.0.0",
      "port_value": 9001
    }
  }
}
結合 Envoy 的初始化配置文件和第 5 節的分析,咱們能夠大體看到 Contour 經過 Envoy 來實現南北流量管理的基本原理。即控制平面將 xDS server 信息經過 static resource 的方式配置到 Envoy 的初始化配置文件中,Envoy 啓動後經過 xDS server 獲取到 dynamic resource,包括集羣中的 service 信息及路由規則。
Envoy 配置初始化流程:
- Envoy initContainer 根據啓動參數和 K8S API Server 中的配置信息生成 Envoy 的初始配置文件
envoy.json,該文件告訴 Envoy 從xDS server中獲取動態配置信息,並配置了 xDS server 的地址信息,即控制平面的Contour。 - Envoy 使用配置文件
envoy.json啓動。 - Envoy 根據獲取到的動態配置啓動 Listener,並根據 Listener 的配置,結合 Route 和 Cluster 對進入的流量進行處理。
8. IngressRoute 配置映射
經過上節的分析咱們知道,Envoy 中實際生效的配置是由初始化配置文件中的靜態配置和從 Contour 獲取的動態配置一塊兒組成的,咱們能夠經過 Envoy 的管理接口來獲取 Envoy 的完整配置,先打開 Envoy 的管理接口:
而後點擊 config_dump,就能看到 Envoy 的完整配置:
咱們在第二節建立了一個 ingressroute,如今來看看它是怎麼映射到 Envoy 的配置文件中的。你能夠到 config_dump 中查找相關配置,但還有更好的辦法,咱們能夠經過 Contour 的命令行工具直接調用 Contour 的 xDS gRPC 接口來分別查看 Envoy 的 Listener、Route、Cluster 和 Endpoint 配置。
Contour 總共有兩個實例,經過選舉來實現高可用,被選中的實例做爲 leader 來對外提供服務。
$ kubectl -n heptio-contour get pod -l app=contour

NAME                       READY   STATUS    RESTARTS   AGE
contour-767fd99989-27qjw   1/1     Running   0          14h
contour-767fd99989-kcjxz   0/1     Running   0          14h
看看哪一個是 leader:
能夠看到該實例不是 leader,咱們到另外一個實例中去查看 Envoy xDS 配置。
Listener
Envoy 採用 listener 來接收並處理 downstream 發過來的請求,listener 的處理邏輯是插件式的,能夠經過配置不一樣的 filter 來插入不一樣的處理邏輯。Listener 能夠綁定到 IP Socket 或者 Unix Domain Socket 上,也能夠不綁定到一個具體的端口上,而是接收從其餘 listener 轉發來的數據。
Listener 的配置能夠經過下面的命令查看:
$ kubectl -n heptio-contour exec -it contour-767fd99989-27qjw -- contour cli --cafile=/ca/cacert.pem --cert-file=/certs/tls.crt --key-file=/certs/tls.key lds
能夠看到 Listener 被綁定到了 80 端口上,同時經過 RDS 配置了一個路由規則 ingress_http,在路由規則中再根據不一樣的請求目的地對請求進行處理。
Route
Route 用來配置 Envoy 的路由規則,根據 host 來對請求進行路由分發。
Route 的配置能夠經過下面的命令查看:
$ kubectl -n heptio-contour exec -it contour-767fd99989-27qjw -- contour cli --cafile=/ca/cacert.pem --cert-file=/certs/tls.crt --key-file=/certs/tls.key rds
上面是 ingress_http 的路由配置,對應了兩個 virtual host,其中一個是默認路由(圖中省略),上面展現的是 kuard 的路由,對應到 Cluster default/kuard/80/da39a3ee5e。其中 domains: "kuard.local:*" 表示容許訪問的域名爲 kuard.local,端口能夠是任意值。
Cluster
Cluster 是一個服務集羣,Cluster 中包含一個到多個 endpoint,每一個 endpoint 均可以提供服務,Envoy 根據負載均衡算法將請求發送到這些 endpoint 中。
Cluster 的配置能夠經過下面的命令查看:
$ kubectl -n heptio-contour exec -it contour-767fd99989-27qjw -- contour cli --cafile=/ca/cacert.pem --cert-file=/certs/tls.crt --key-file=/certs/tls.key cds
cluster_name: "contour" 表示經過 xDS 接口從 contour 控制平面動態獲取 Endpoint 信息。獲取到的 Endpoint 是 default/kuard。
Endpoint
Endpoint 就對應到 Kubernetes 中的 Endpoint 資源,對應的便是 Pod 的 IP+Port。
Cluster 的配置能夠經過下面的命令查看:
$ kubectl -n heptio-contour exec -it contour-767fd99989-27qjw -- contour cli --cafile=/ca/cacert.pem --cert-file=/certs/tls.crt --key-file=/certs/tls.key eds|grep "default/kuard" -A 34 -B 2
驗證一下:
$ kubectl get ep -l app=kuard

NAME    ENDPOINTS                                                     AGE
kuard   100.118.117.18:8080,100.119.55.150:8080,100.91.147.204:8080   17h
9. 對接監控
Contour 和 Envoy 都暴露一些監控指標能夠被 Prometheus 抓取,官方也提供了 Prometheus 和 Grafana 的部署模板,但通常狀況下咱們都會有本身的監控系統,好比 prometheus-operator,只須要將官方的 Grafana 模板導入本身的 Grafana 中就能夠了,後續會探討詳細步驟。
Envoy Metrics
Envoy 默認經過 admin 接口暴露監控指標,爲了不暴露 admin 接口,Contour 建立了一個靜態 Listener,只將訪問路徑爲 /stats 的流量轉發到 service-stats Cluster,即 admin 接口,其餘全部請求一概拒絕訪問。
> 本文只是爲了方便查看,纔將 admin 接口的 IP 改成 0.0.0.0,生產環境建議不要改,默認值爲 127.0.0.1。
因此 Envoy 在 8002 端口暴露監控指標,路徑爲 /stats/prometheus。
Contour Metrics
Contour 在 8000 端口上暴露監控指標,路徑爲 /metrics。包含如下監控指標:
- contour_ingressroute_total (gauge) : IngressRoute 的總數量,包括狀態爲
Valid / Invalid / Orphaned的 IngressRoute。 - contour_ingressroute_orphaned_total (gauge) : 狀態爲
Orphaned的 IngressRoute 數量。 - contour_ingressroute_root_total (gauge) :
RootIngressRoute 的數量(每一個 vhost 只有一個 Root IngressRoute)。 - contour_ingressroute_valid_total (gauge) : 狀態爲
Valid的 IngressRoute 數量。 - contour_ingressroute_invalid_total (gauge) : 狀態爲
Invalid的 IngressRoute 數量。 contour_ingressroute_dagrebuild_timestamp (gauge): 最近一次重建 DAG 的時間戳。
下面就來教你們怎麼將 Contour 接入 Prometheus-Operator,對 Prometheus-Operator 不熟的同窗,推薦看一下張館長的這篇文章:全手動部署prometheus-operator監控Kubernetes集羣遇到的坑。
RBAC 受權
爲了讓 Prometheus 可以 list 其餘 namespace 中的 pod,咱們須要賦予它相應的權限,首先進入 kube-prometheus 項目的 manifests 目錄:
$ cd kube-prometheus/manifests

$ ll *SpecificNamespace*
4 -rw-r--r-- 1 root root  988 8月  27 05:22 prometheus-roleBindingSpecificNamespaces.yaml
4 -rw-r--r-- 1 root root 1078 8月  27 05:15 prometheus-roleSpecificNamespaces.yaml
修改 prometheus-roleSpecificNamespaces.yaml,向其中添加以下的 Role:
- apiVersion: rbac.authorization.k8s.io/v1
  kind: Role
  metadata:
    name: prometheus-k8s
    namespace: heptio-contour
  rules:
  - apiGroups:
    - ""
    resources:
    - services
    - endpoints
    - pods
    verbs:
    - get
    - list
    - watch
修改 prometheus-roleBindingSpecificNamespaces.yaml,向其中添加以下的 RoleBinding:
- apiVersion: rbac.authorization.k8s.io/v1
  kind: RoleBinding
  metadata:
    name: prometheus-k8s
    namespace: heptio-contour
  roleRef:
    apiGroup: rbac.authorization.k8s.io
    kind: Role
    name: prometheus-k8s
  subjects:
  - kind: ServiceAccount
    name: prometheus-k8s
    namespace: monitoring
而後建立相應的 Role 和 RoleBinding:
$ kubectl apply -f prometheus-roleSpecificNamespaces.yaml
$ kubectl apply -f prometheus-roleBindingSpecificNamespaces.yaml
修改 Contour manifest 文件
Prometheus 監控的對象被叫作 Target,Target 經過 Cluster 中的 Endpoint 資源來定義,每一個監控對象都有一個對應的 Endpoint。而 ServiceMonitor 是 Target 的抽象,ServiceMonitor 經過標籤來找到對應的 Endpoint,而後將相應的 Target 添加到 Prometheus 的監控列表中。
默認狀況下 Contour 的 Service 是沒有打標籤的,因此咱們須要修改 yaml 文件,加上相應的標籤。首先修改 Contour Deployment 的 yaml 文件:
# 03-contour.yaml
ports:
- containerPort: 8001
  name: xds
  protocol: TCP
- containerPort: 8000
  name: http-metrics # 將 name 改成 http-metrics
  protocol: TCP
再修改 Contour Service 的 yaml 文件:
# 02-service-envoy.yaml
ports:
- port: 80
  name: http
  protocol: TCP
- port: 443
  name: https
  protocol: TCP
# 添加新端口
- port: 8002
  name: http-metrics
  protocol: TCP
Envoy 相似,先修改 Envoy Deployment 的 yaml 文件:
# 03-envoy.yaml
ports:
- containerPort: 80
  hostPort: 80
  name: http
  protocol: TCP
- containerPort: 443
  hostPort: 443
  name: https
  protocol: TCP
# 添加新端口
- containerPort: 8002
  hostPort: 8002
  name: http-metrics
  protocol: TCP
再修改 Envoy Service 的 yaml 文件:
# 02-service-envoy.yaml
ports:
- port: 80
  name: http
  protocol: TCP
- port: 443
  name: https
  protocol: TCP
# 添加新端口
- port: 8002
  name: http-metrics
  protocol: TCP
最後從新 apply 一下:
# 在 contour/examples/ds-hostnet-split 目錄下
$ kubectl apply -f ./
建立 ServiceMonitor
接下來就是建立相應的 ServiceMonitor 來抓取指標數據,沒什麼好說的,本身看 yaml 文件:
$ cat prometheus-serviceMonitorContour.yaml

apiVersion: monitoring.coreos.com/v1
kind: ServiceMonitor
metadata:
  labels:
    app: contour
  name: contour
  namespace: monitoring
spec:
  endpoints:
  - interval: 30s
    port: http-metrics
  jobLabel: app
  namespaceSelector:
    matchNames:
    - heptio-contour
  selector:
    matchLabels:
      app: contour
---
apiVersion: monitoring.coreos.com/v1
kind: ServiceMonitor
metadata:
  labels:
    app: envoy
  name: envoy
  namespace: monitoring
spec:
  endpoints:
  - interval: 30s
    path: /stats/prometheus
    port: http-metrics
  namespaceSelector:
    matchNames:
    - heptio-contour
  selector:
    matchLabels:
      app: envoy
建立 IngressRoute
爲了查看 Prometheus 和 Grafana 的 Dashboard,咱們須要爲它們建立相應的 IngressRoute,yaml 文件內容以下:
# ingressroute-prometheus.yaml
apiVersion: contour.heptio.com/v1beta1
kind: IngressRoute
metadata:
  labels:
    app: grafana
  name: grafana
  namespace: monitoring
spec:
  virtualhost:
    fqdn: grafana.sealos.io
  routes:
    - match: /
      services:
        - name: grafana
          port: 3000
---
apiVersion: contour.heptio.com/v1beta1
kind: IngressRoute
metadata:
  labels:
    app: prometheus
  name: prometheus
  namespace: monitoring
spec:
  virtualhost:
    fqdn: prometheus.sealos.io
  routes:
    - match: /
      services:
        - name: prometheus-k8s
          port: 9090
直接 apply:
$ kubectl apply -f ingressroute-prometheus.yaml
將域名寫入本地電腦的 hosts 中:
$ echo "$INGRESS_HOST grafana.sealos.io" >> /etc/hosts
$ echo "$INGRESS_HOST prometheus.sealos.io" >> /etc/hosts
其中 $INGRESS_HOST 是任意運行 Envoy 節點的 IP。
如今咱們能夠在瀏覽器中輸入域名 prometheus.sealos.io 來查看 Prometheus Target 狀態。
能夠看到這兩個 Target 已經被抓取到了。
導入 Grafana 模板
前面提到 Contour 官方倉庫中提供了 Grafana Dashboard 模板,如今咱們要作的事就是把這個模板導入到本身的 Grafana 中。官方的 Grafana Dashboard 模板定義在 contour/examples/grafana 目錄下的 ConfigMap 文件中,能夠先把它導出來:
# 假設 contour 項目在你的 $HOME 目錄
$ sed '/---/,$d' ~/contour/examples/grafana/02-grafana-configmap.yaml \
  sed 's/grafana-dashs/grafana-dashboard-contour/' \
  sed 's/contour-monitoring/monitoring/' \
  sed 's/kubernetes_pod_name/pod/g' \
  sed 's/ingress_http_update/update/g' \
  kubectl apply -f -

configmap/grafana-dashboard-contour created
建立了 ConfigMap 後,還要再掛載到 Grafana 的 Dashboard 中,因此須要修改 Grafana Deployment 的 yaml 文件:
# ~/kube-prometheus/manifests/grafana-deployment.yaml
        volumeMounts:
        - mountPath: /var/lib/grafana
          name: grafana-storage
          readOnly: false
        ...省略...
        # 新增掛載
        - mountPath: /grafana-dashboard-definitions/0/contour
          name: grafana-dashboard-contour
          readOnly: false
        ...省略...
      volumes:
      - emptyDir: {}
        name: grafana-storage
      ...省略...
      # 新增 ConfigMap
      - configMap:
          name: grafana-dashboard-contour
        name: grafana-dashboard-contour
從新 apply 一下:
$ kubectl apply -f grafana-deployment.yaml
如今在瀏覽器中輸入域名 grafana.sealos.io,就能夠看到 Contour 和 Envoy 的 Dashboard 了。
對接監控到這裏就結束了,剩下的你們能夠本身去探索,整體來講難度仍是稍微有點大,但願個人細心講解可以幫助到你。
微信公衆號
掃一掃下面的二維碼關注微信公衆號,在公衆號中回覆◉加羣◉便可加入咱們的雲原生交流羣,和孫宏亮、張館長、陽明等大佬一塊兒探討雲原生技術
</none>
- 1. Contour 學習筆記(一):使用 Contour 接管 Kubernetes 的南北流量
- 2. matlab—contour
- 3. matlab中contour函數的返回值contour matrix C如何使用
- 4. origin contour用法
- 5. Contour Processing
- 6. MATLAB - contour函數
- 7. MATLAB 中contour的應用
- 8. contour 函數詳解
- 9. 使用contour自定義等高線值
- 10. MATLAB中contour函數用法
- 更多相關文章...
- • 我們已經學習了 SQL,下一步學習什麼呢? - SQL 教程
- • 您已經學習了 XML Schema,下一步學習什麼呢? - XML Schema 教程
- • Tomcat學習筆記(史上最全tomcat學習筆記)
- • 適用於PHP初學者的學習線路和建議
-
每一个你不满意的现在,都有一个你没有努力的曾经。