Hystrix Dashboard:斷路器執行監控
SpringBoot實戰電商項目mall(20k+star)地址: https://github.com/macrozheng/mall
摘要
Hystrix Dashboard 是Spring Cloud中查看Hystrix實例執行狀況的一種儀表盤組件,支持查看單個實例和查看集羣實例,本文將對其用法進行詳細介紹。java
簡介
Hystrix提供了Hystrix Dashboard來實時監控HystrixCommand方法的執行狀況。 Hystrix Dashboard能夠有效地反映出每一個Hystrix實例的運行狀況,幫助咱們快速發現系統中的問題,從而採起對應措施。git
Hystrix 單個實例監控
咱們先經過使用Hystrix Dashboard監控單個Hystrix實例來了解下它的使用方法。
建立一個hystrix-dashboard模塊
用來監控hystrix實例的執行狀況。
- 在pom.xml中添加相關依賴:
<dependency>
    <groupId>org.springframework.cloud</groupId>
    <artifactId>spring-cloud-starter-netflix-eureka-client</artifactId>
</dependency>
<dependency>
    <groupId>org.springframework.cloud</groupId>
    <artifactId>spring-cloud-starter-netflix-hystrix-dashboard</artifactId>
</dependency>
<dependency>
    <groupId>org.springframework.boot</groupId>
    <artifactId>spring-boot-starter-actuator</artifactId>
</dependency>
- 在application.yml進行配置:
server:
  port: 8501
spring:
  application:
    name: hystrix-dashboard
eureka:
  client:
    register-with-eureka: true
    fetch-registry: true
    service-url:
      defaultZone: http://localhost:8001/eureka/
- 在啓動類上添加@EnableHystrixDashboard來啓用監控功能:
@EnableHystrixDashboard
@EnableDiscoveryClient
@SpringBootApplication
public class HystrixDashboardApplication {

    public static void main(String[] args) {
        SpringApplication.run(HystrixDashboardApplication.class, args);
    }

}
啓動相關服務
此次咱們須要啓動以下服務:eureka-server、user-service、hystrix-service、hystrix-dashboard,啓動後註冊中心顯示以下。

Hystrix實例監控演示
- 訪問Hystrix Dashboard:http://localhost:8501/hystrix

- 填寫好信息後點擊監控按鈕,這裏咱們須要注意的是,因爲咱們本地不支持https,因此咱們的地址須要填入的是http,不然會沒法獲取監控信息;
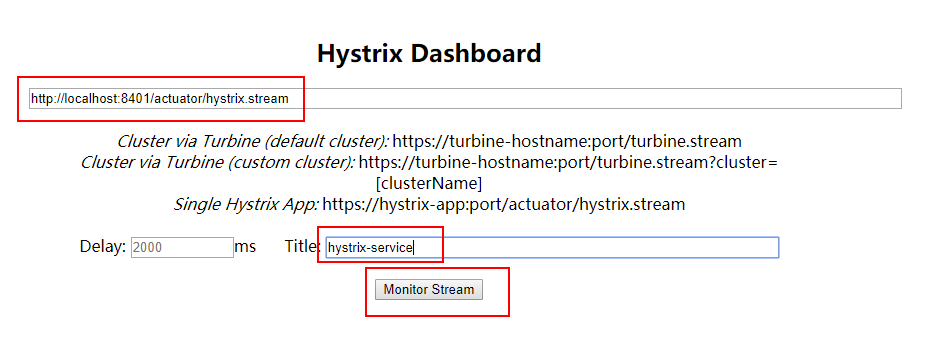
- 還有一點值得注意的是,被監控的hystrix-service服務須要開啓Actuator的hystrix.stream端點,配置信息以下:
management:
  endpoints:
    web:
      exposure:
        include: 'hystrix.stream' #暴露hystrix監控端點
- 調用幾回hystrix-service的接口:http://localhost:8401/user/testCommand/1
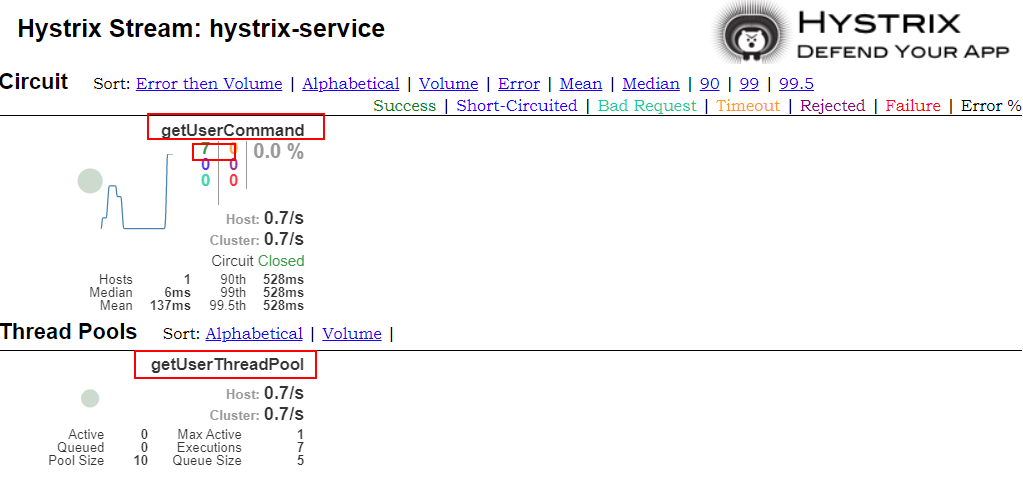
- 能夠發現曾經咱們在@HystrixCommand中添加的commandKey和threadPoolKey屬性都顯示在上面了,而且有7次調用都成功了。
Hystrix Dashboard 圖表解讀
圖表解讀以下,須要注意的是,小球表明該實例健康狀態及流量狀況,顏色越顯眼,表示實例越不健康,小球越大,表示實例流量越大。曲線表示Hystrix實例的實時流量變化。

Hystrix 集羣實例監控
這裏咱們使用Turbine來聚合hystrix-service服務的監控信息,而後咱們的hystrix-dashboard服務就能夠從Turbine獲取聚合好的監控信息展現給咱們了。
建立一個turbine-service模塊
用來聚合hystrix-service的監控信息。
- 在pom.xml中添加相關依賴:
<dependency>
    <groupId>org.springframework.cloud</groupId>
    <artifactId>spring-cloud-starter-netflix-eureka-client</artifactId>
</dependency>
<dependency>
    <groupId>org.springframework.cloud</groupId>
    <artifactId>spring-cloud-starter-netflix-turbine</artifactId>
</dependency>
<dependency>
    <groupId>org.springframework.boot</groupId>
    <artifactId>spring-boot-starter-actuator</artifactId>
</dependency>
- 在application.yml進行配置,主要是添加了Turbine相關配置:
server:
  port: 8601
spring:
  application:
    name: turbine-service
eureka:
  client:
    register-with-eureka: true
    fetch-registry: true
    service-url:
      defaultZone: http://localhost:8001/eureka/
turbine:
  app-config: hystrix-service #指定須要收集信息的服務名稱
  cluster-name-expression: new String('default') #指定服務所屬集羣
  combine-host-port: true #以主機名和端口號來區分服務
- 在啓動類上添加@EnableTurbine來啓用Turbine相關功能:
@EnableTurbine
@EnableDiscoveryClient
@SpringBootApplication
public class TurbineServiceApplication {

    public static void main(String[] args) {
        SpringApplication.run(TurbineServiceApplication.class, args);
    }

}
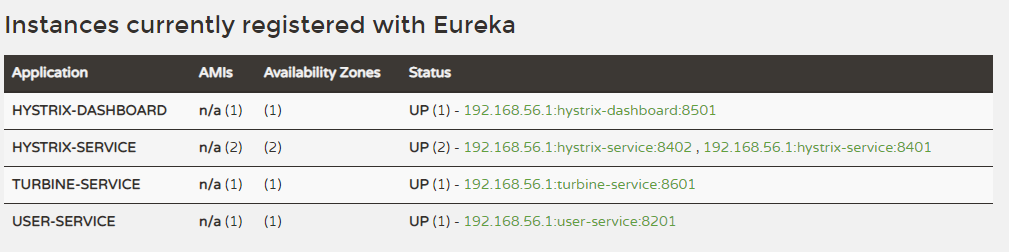
啓動相關服務
使用application-replica1.yml配置再啓動一個hystrix-service服務,啓動turbine-service服務,此時註冊中心顯示以下。
Hystrix集羣監控演示
- 訪問Hystrix Dashboard:http://localhost:8501/hystrix
- 添加集羣監控地址,須要注意的是咱們須要添加的是turbine-service的監控端點地址:

- 調用幾回hystrix-service的接口:http://localhost:8401/user/testCommand/1以及http://localhost:8402/user/testCommand/1
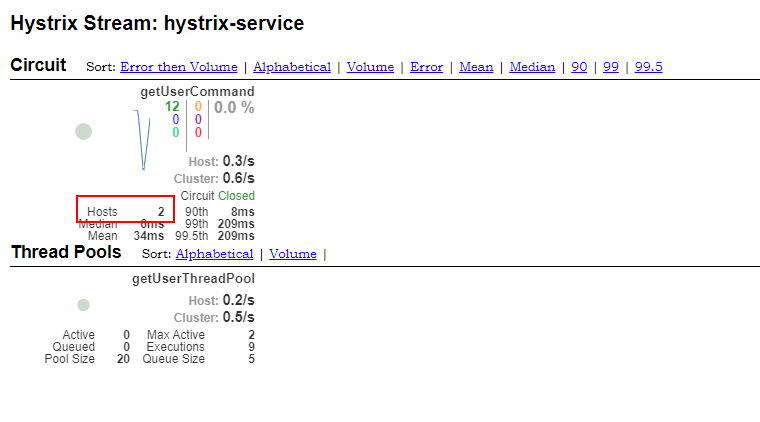
- 能夠看到咱們的Hystrix實例數量變成了兩個。
使用到的模塊
springcloud-learning
├── eureka-server -- eureka註冊中心
├── user-service -- 提供User對象CRUD接口的服務
├── hystrix-service -- hystrix服務調用測試服務
├── turbine-service -- 聚合收集hystrix實例監控信息的服務
└── hystrix-dashboard -- 展現hystrix實例監控信息的儀表盤
項目源碼地址
https://github.com/macrozheng/springcloud-learninggithub
公衆號
mall項目全套學習教程連載中,關注公衆號第一時間獲取。web

相關文章
- 1. Hystrix Dashboard:斷路器執行監控
- 2. Spring Cloud(五)斷路器監控(Hystrix Dashboard)
- 3. SpringCloud之斷路器監控(Hystrix Dashboard)(九)
- 4. 斷路器監控Hystrix Dashboard的使用
- 5. 熔斷器Hystrix及服務監控Dashboard
- 6. 服務容錯保護斷路器Hystrix之三:斷路器監控(Hystrix Dashboard)-單體監控
- 7. 服務容錯保護斷路器Hystrix之四:斷路器監控(Hystrix Dashboard)-turbine集羣監控
- 8. SpringCloud學習系列之三----- 斷路器(Hystrix)和斷路器監控(Dashboard)
- 9. 1四、Ribbon整合斷路器監控Hystrix Dashboard
- 10. Spring Cloud Learning | 第七篇:斷路器監控儀表盤(Hystrix Dashboard)
- 更多相關文章...
- • MyBatis SqlSession和Mapper接口執行Sql - MyBatis教程
- • Redis watch命令——監控事務 - Redis教程
- • Docker容器實戰(七) - 容器眼光下的文件系統
- • Docker容器實戰(六) - 容器的隔離與限制
相關標籤/搜索
每日一句
-
每一个你不满意的现在,都有一个你没有努力的曾经。
最新文章
歡迎關注本站公眾號,獲取更多信息

相關文章
- 1. Hystrix Dashboard:斷路器執行監控
- 2. Spring Cloud(五)斷路器監控(Hystrix Dashboard)
- 3. SpringCloud之斷路器監控(Hystrix Dashboard)(九)
- 4. 斷路器監控Hystrix Dashboard的使用
- 5. 熔斷器Hystrix及服務監控Dashboard
- 6. 服務容錯保護斷路器Hystrix之三:斷路器監控(Hystrix Dashboard)-單體監控
- 7. 服務容錯保護斷路器Hystrix之四:斷路器監控(Hystrix Dashboard)-turbine集羣監控
- 8. SpringCloud學習系列之三----- 斷路器(Hystrix)和斷路器監控(Dashboard)
- 9. 1四、Ribbon整合斷路器監控Hystrix Dashboard
- 10. Spring Cloud Learning | 第七篇:斷路器監控儀表盤(Hystrix Dashboard)